Svenesis Multiple Histogram Viewer
Version 1.1.0 – GPL-3.0-or-later
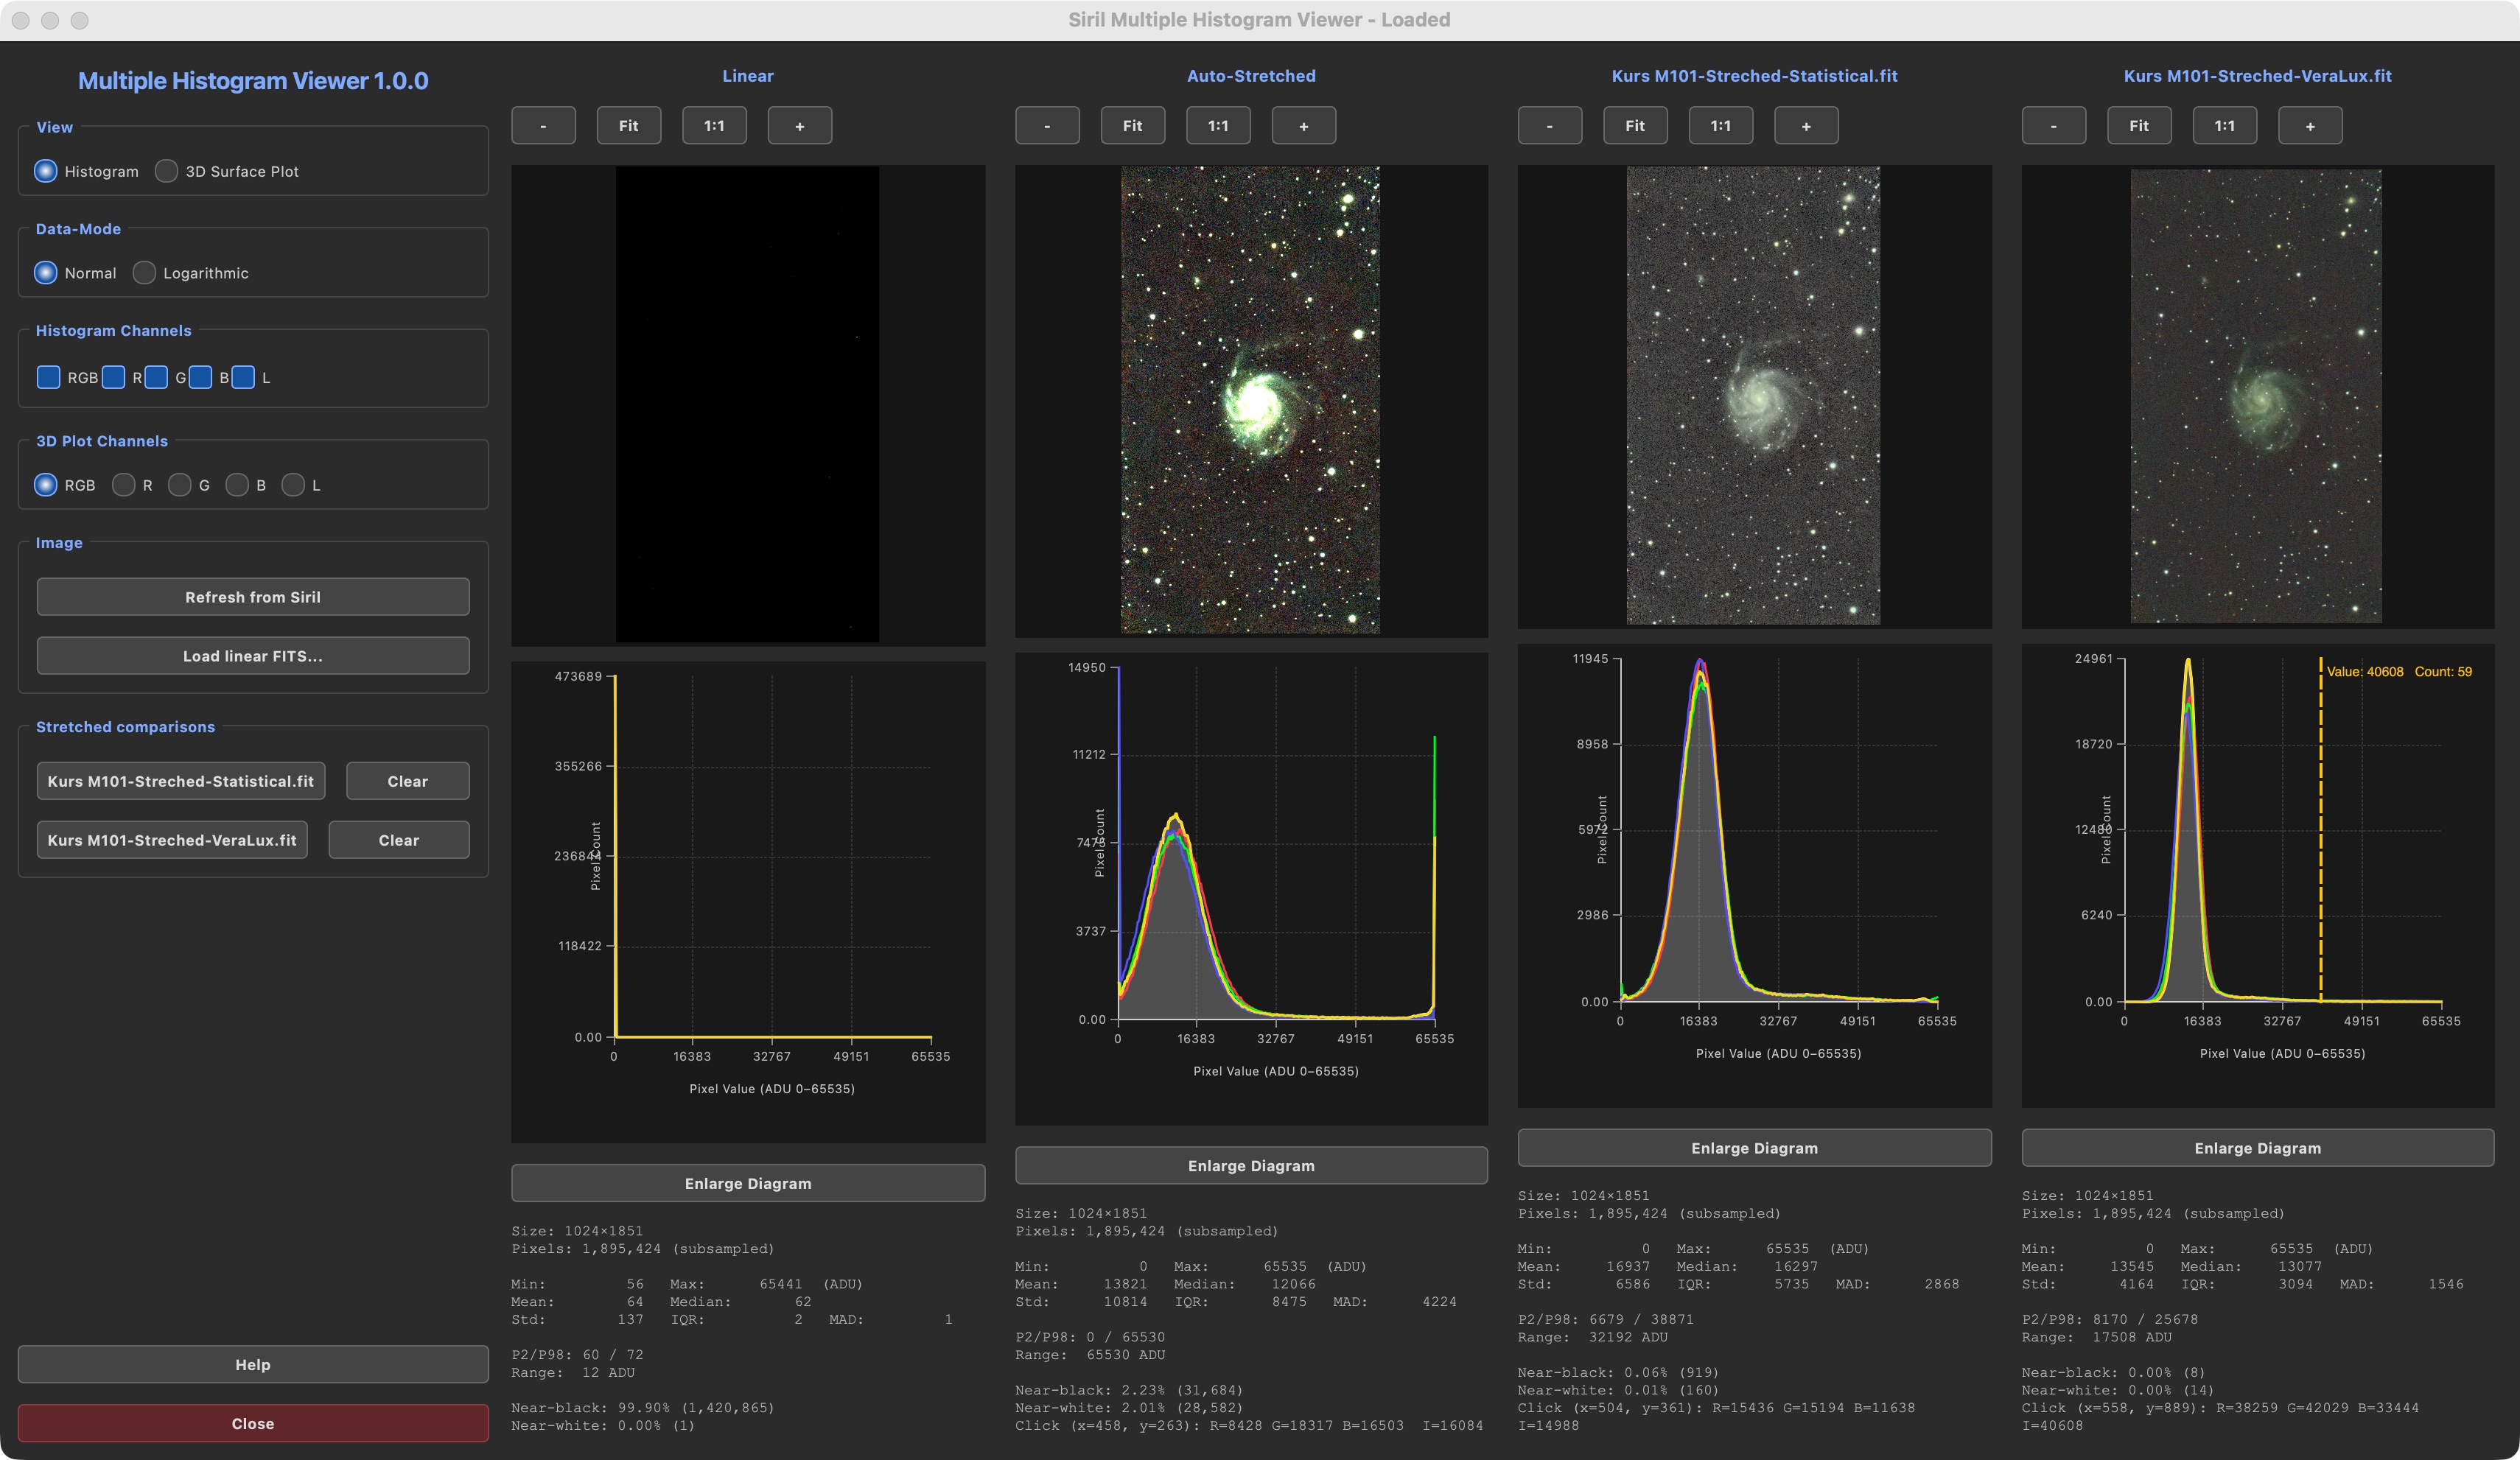
Displays linear and auto-stretched images side by side with RGB histograms, 3D surface plots, and detailed statistics.
Features
- Multi-column display: original data alongside stretched versions in up to 4 columns
- Per-channel histogram analysis: RGB, R, G, B, and luminance individually
- 3D surface visualization for detecting gradients and vignetting
- Interactive pixel sampling: click shows exact ADU values and histogram position
- Comprehensive statistics: Min/Max, Mean, Median, Std Dev, IQR, MAD, percentiles
- Logarithmic scaling to reveal faint signals
- Support for compressed FITS files (.fz, .gz)
- Load up to 2 additional stretched FITS files for comparison
Workflow
Load FITS image → linear and stretched views immediately available → load stretched FITS for comparison → switch channels → inspect pixels.
Dependencies
numpy, PyQt6, Pillow, astropy, matplotlib